- On this page
- 2
- figures
- 3
- tables
- 1
- panel
- 17
- references
Star class · 56 sim stellar types; 32 galaxy-map display classes
Stellar classification
ContentsShow
Stellar classification is the sorting of stars by their spectra, the patterns of dark lines that atoms and molecules in a star's atmosphere cut into its light. Each star gets a letter, O, B, A, F, G, K or M, running from the hottest to the coolest, with L, T and Y added for the still cooler brown dwarfs; a number from 0 to 9 that divides each letter into finer steps; and a Roman numeral, the luminosity class, that says whether the star is a compact dwarf or a swollen giant. The Sun is a G2V star: a yellow-white, hydrogen-burning main-sequence star with a surface temperature of 5,772 K 1. A spectral type sums up a star's temperature, size and stage of life in three characters, and it is the first thing astronomers look up about a star.
The spectral sequence
From Harvard's letters to temperatures
The letters come from the Harvard College Observatory, where in the 1890s Edward Pickering's team photographed and sorted the spectra of hundreds of thousands of stars. Annie Jump Cannon refined the system while classifying the southern sky 2, and the resulting Henry Draper Catalogue, published between 1918 and 1924, gave spectral types for 225,300 stars down to about ninth magnitude 3. The letters were first assigned alphabetically by the strength of the hydrogen lines, then reordered into the sequence OBAFGKM once it became clear that the sequence was one of temperature. Cecilia Payne's 1925 thesis applied the new physics of atomic ionisation to show how temperature, rather than differences in composition, controls which lines a star shows 4.
Temperature matters because it decides which atoms are ionised and which molecules survive. In the hottest stars even helium loses an electron; in the coolest, molecules such as titanium oxide can form. The hallmarks of each class are these 5 6:
| Class | Surface temperature (main sequence) | Hallmark lines | Example |
|---|---|---|---|
| O | above about 31,500 K | Ionised helium | Zeta Ophiuchi |
| B | about 10,000 to 31,500 K | Neutral helium; hydrogen strengthening | Rigel, Spica |
| A | about 7,300 to 10,000 K | Hydrogen strongest | Sirius A, Vega |
| F | about 6,000 to 7,300 K | Hydrogen weakening; ionised calcium and metals | Procyon A |
| G | about 5,300 to 6,000 K | Ionised calcium very strong; many metal lines | The Sun, Alpha Centauri A |
| K | about 3,900 to 5,300 K | Neutral metals; molecular bands appear | Alpha Centauri B, Arcturus |
| M | about 2,350 to 3,900 K | Titanium oxide bands | Proxima Centauri, Betelgeuse |
The boundaries in the table are the temperatures between the last subtype of one class and the first of the next in Eric Mamajek's compilation of main-sequence stars, which builds on Pecaut and Mamajek (2013) 7 8. Giants and supergiants of the same spectral type are slightly cooler.
Beyond M
Surveys in the infrared found objects cooler than any M star. Class L was defined in 1999 from 2MASS discoveries, for objects around 1,300 to 2,300 K whose spectra show metal hydrides and alkali metals 9. Class T, with strong methane absorption, followed 10, and the first Y dwarfs, below about 500 K, were found with the WISE satellite in 2011 11. Most L dwarfs and all T and Y dwarfs are brown dwarfs, objects too small to sustain hydrogen fusion.
Special classes cover stars whose chemistry, not temperature, sets their spectra: W for the hot, stripped Wolf-Rayet stars, C for carbon stars, S for giants rich in zirconium oxide, and D for white dwarfs.
Luminosity classes
Two stars of the same temperature can differ in size by a factor of a thousand, and the spectrum shows which is which. A giant's atmosphere is thin and its surface gravity weak, so its absorption lines are narrower than those of a dwarf, whose denser gas broadens them. In 1943 William Morgan, Philip Keenan and Edith Kellman at Yerkes Observatory published the atlas that added this second dimension, now called the MK (or MKK) system 12 5:
| Class | Meaning | Example |
|---|---|---|
| 0 or Ia+ | Hypergiant | Rho Cassiopeiae |
| Ia, Iab, Ib | Luminous, intermediate and less luminous supergiants | Rigel (B8Ia), Betelgeuse |
| II | Bright giant | |
| III | Giant | Arcturus (K1.5III), Aldebaran |
| IV | Subgiant | |
| V | Main-sequence star ("dwarf") | The Sun (G2V) |
| VI | Subdwarf | |
| VII | White dwarf (rarely used; white dwarfs have their own D classes) |
Classifiers add finer notes: "e" for emission lines, "p" for peculiar, and so on. The standard stars that define the classes are listed in catalogues such as the Perkins catalogue of cooler stars 13.
The main sequence in numbers
Most stars spend most of their lives on the main sequence, fusing hydrogen in their cores, and along it spectral type is tied to mass, size and brightness. Representative values 7 8:
| Type | Temperature (K) | Mass (Sun = 1) | Radius (Sun = 1) | Luminosity (Sun = 1) | B-V colour | Absolute magnitude M_V |
|---|---|---|---|---|---|---|
| O5V | 41,400 | 43 | 11.5 | about 350,000 | -0.32 | -5.35 |
| B0V | 31,400 | 17.7 | 7.2 | about 45,000 | -0.30 | -3.90 |
| A0V | 9,700 | 2.18 | 2.19 | 38 | 0.00 | 0.99 |
| F0V | 7,220 | 1.61 | 1.73 | 7.2 | 0.30 | 2.57 |
| G2V | 5,770 | 1.00 | 1.01 | 1.02 | 0.65 | 4.80 |
| K0V | 5,270 | 0.88 | 0.81 | 0.46 | 0.82 | 5.78 |
| K5V | 4,440 | 0.70 | 0.70 | 0.17 | 1.15 | 7.28 |
| M0V | 3,850 | 0.57 | 0.59 | 0.069 | 1.42 | 8.80 |
| M5V | 3,060 | 0.162 | 0.196 | 0.0030 | 1.83 | 14.15 |
| M9V | 2,380 | 0.079 | 0.102 | 0.0003 | 2.17 | 19.40 |
Luminosity rises steeply with mass: an O5 star is about 40 times the Sun's mass but hundreds of thousands of times as bright, and burns out in a few million years, while an M dwarf will outlive the present age of the universe many times over. The compiler notes that the mean masses are tentative, and the O5V row and the absolute magnitudes come from the online table rather than the 2013 paper 7.
The Hertzsprung-Russell diagram
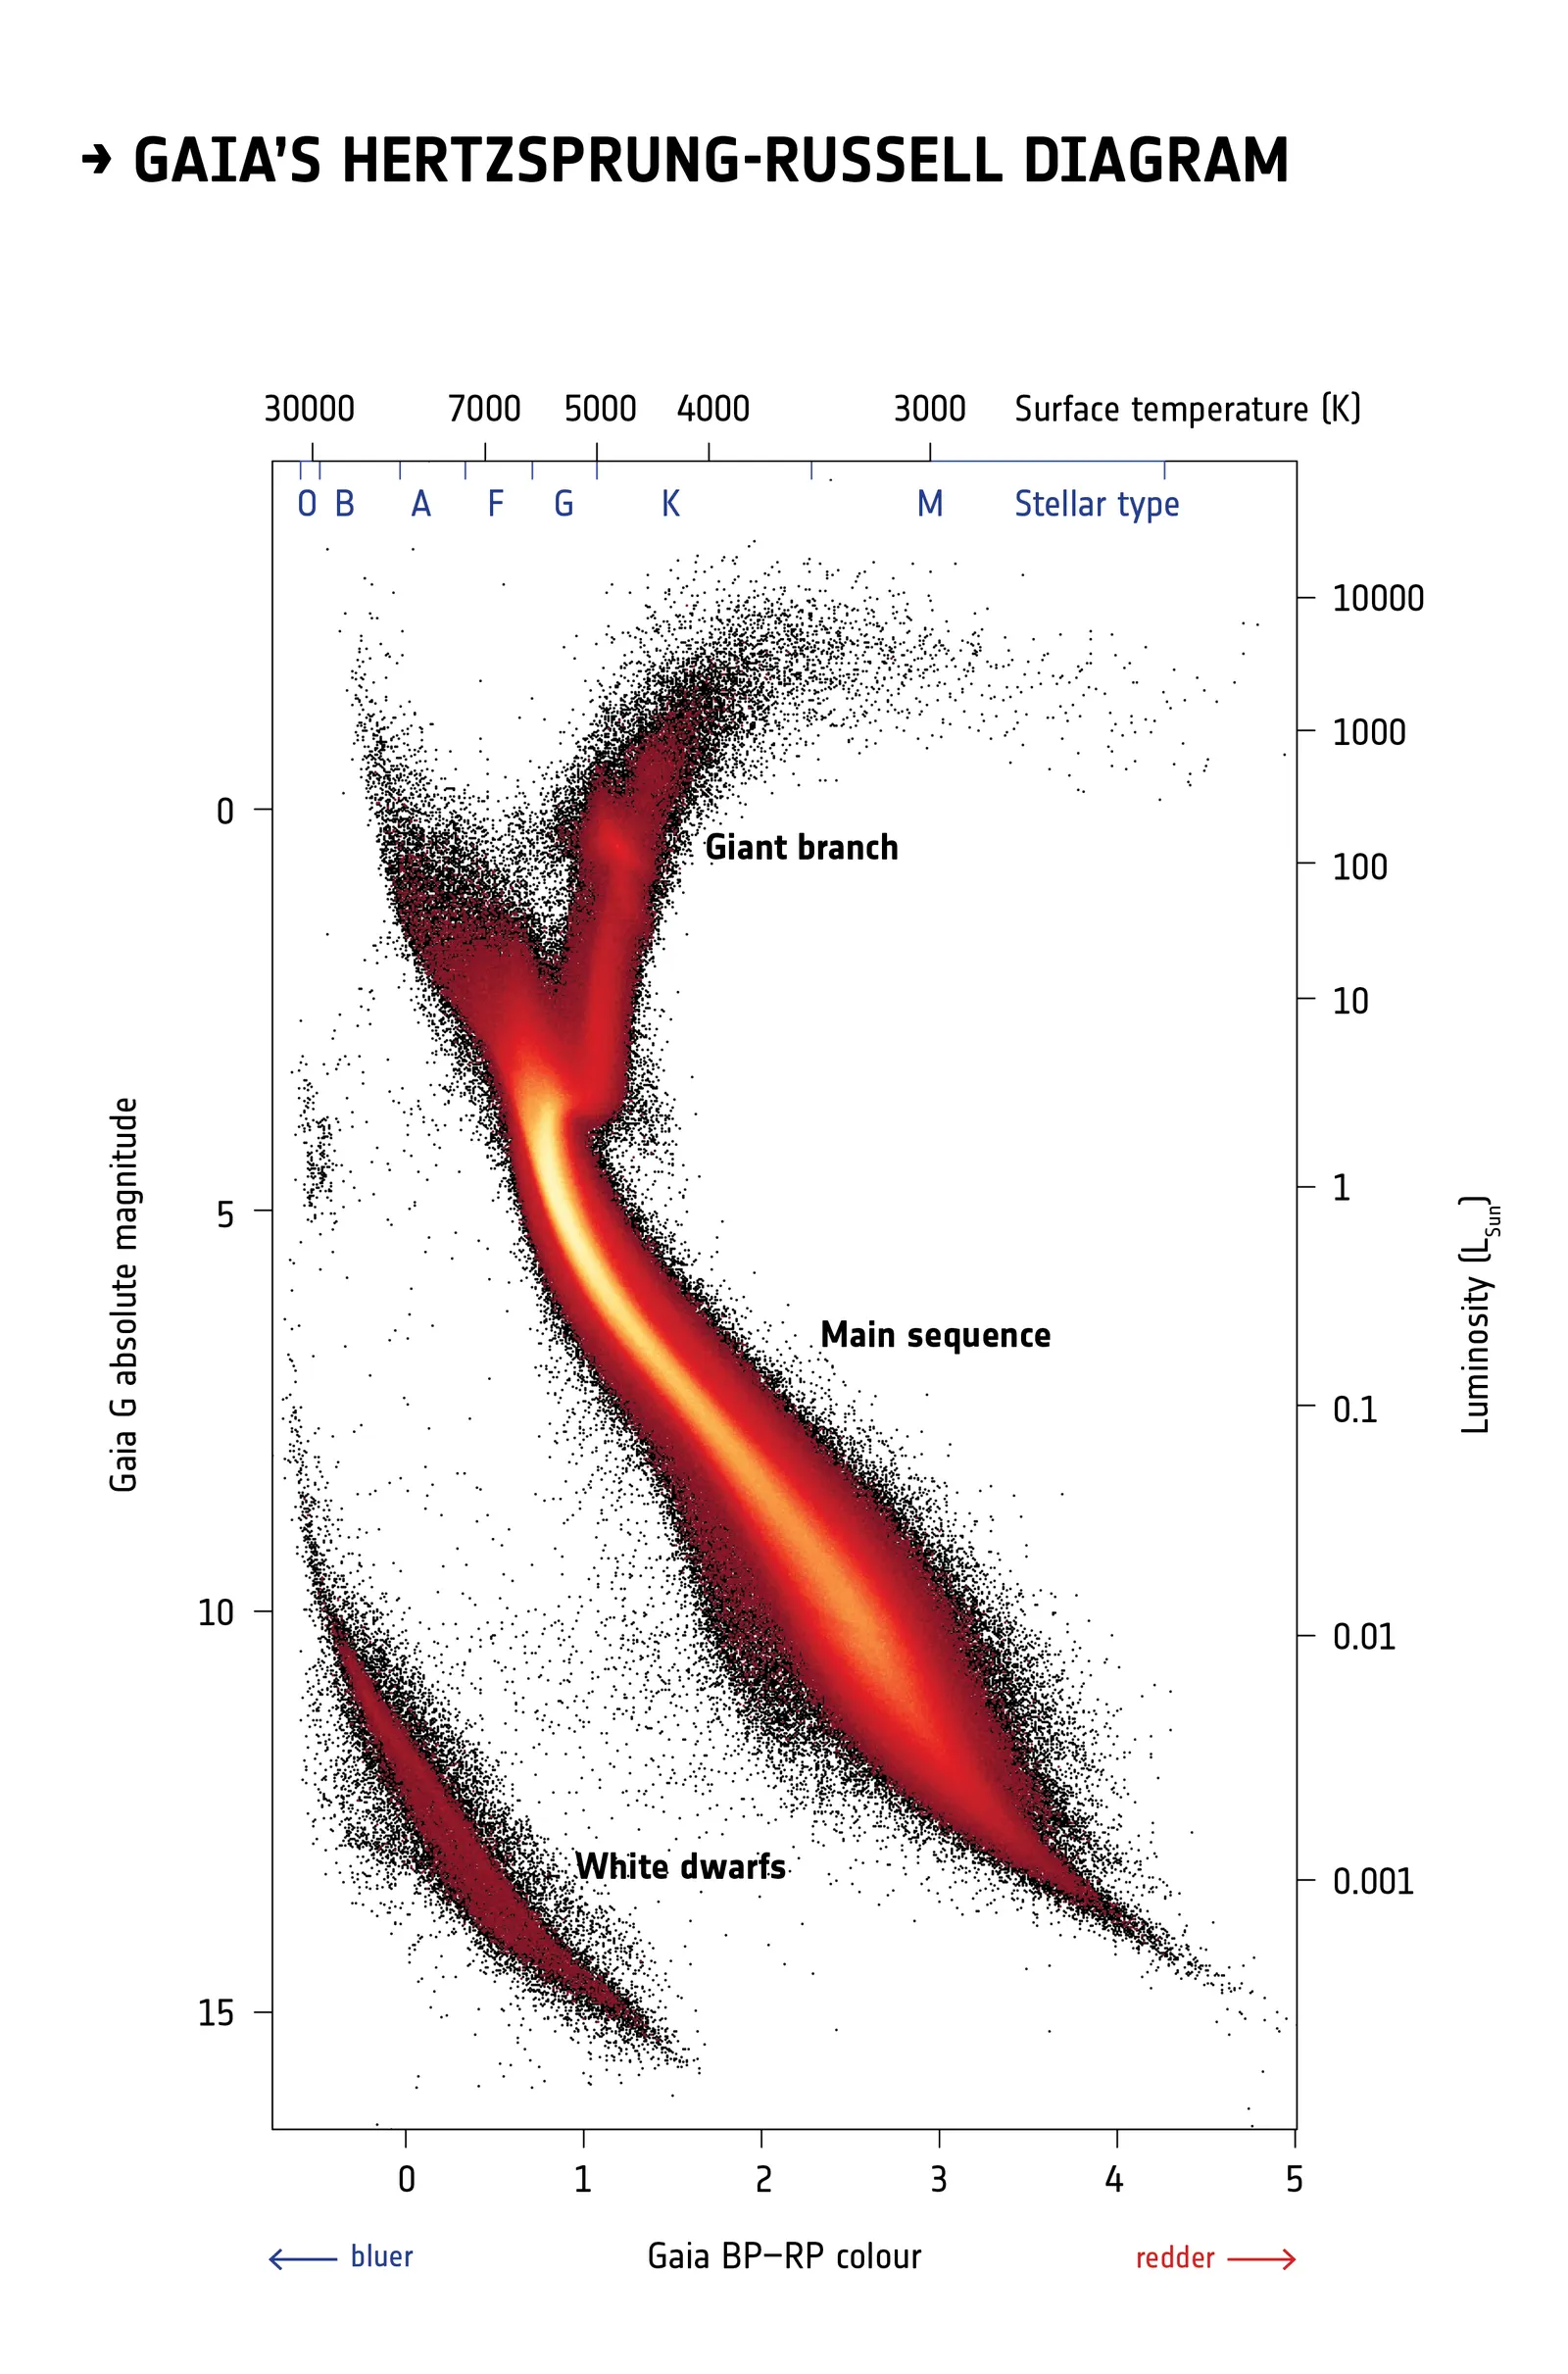
Plotting stars' temperature (or colour, or spectral type) against their luminosity gives the Hertzsprung-Russell diagram, in which the luminosity classes separate into bands: the main sequence running diagonally, the giants and supergiants above it, and the white dwarfs below. The European Space Agency's Gaia mission has measured distances to so many stars that its diagram of the solar neighbourhood shows these sequences with unprecedented sharpness, including fine structure within the main sequence and the white dwarf sequence 14.
What colour are stars?
Stellar colours are subtler than the letters suggest. Folding model stellar spectra through the colour response of the human eye shows that there are no green or purple stars. M dwarfs look orange rather than red, the Sun seen from space is white with the faintest yellow tint, and the whitest stars are late F types 15. To the naked eye most stars look white, because at low light levels the eye sees little colour.
How common is each class?
The brightest stars in the sky are a poor guide, because luminous stars are seen from far away. A census of every star within 10 parsecs (about 33 light years) finds 249 M dwarfs, 38 K stars, 18 G stars, 8 F stars, 4 A stars and 20 white dwarfs, with no giants at all 16. That is roughly three quarters M dwarfs, one in nine K dwarfs, one in twenty G stars like the Sun, and hardly any A, B or O stars. The RECONS census of the same volume gives nearly identical shares 17.
See also
- Red dwarf
- K-type main-sequence star
- G-type main-sequence star
- Red giant
- Supergiant
- Brown dwarf
- White dwarf
- Neutron star
- Star catalogue
References
- 1Prša, A. et al. (2016). Nominal Values for Selected Solar and Planetary Quantities: IAU 2015 Resolution B3. The Astronomical Journal 152, 41. doi:10.3847/0004-6256/152/2/41
- 2Pickering, E. C. and Cannon, A. J. (1897). Spectra of bright southern stars. The Astrophysical Journal 6, 349. doi:10.1086/140407
- 3Cannon, A. J. and Pickering, E. C.. Henry Draper Catalogue and Extension (Annals of Harvard College Observatory 91 to 100), VizieR III/135A. vizier.cds.unistra.fr/viz-bin/VizieR?-source=III/135A
- 4Struve, O. (1926). Review: Stellar Atmospheres. A Contribution to the Study of High Temperature Ionization in the Reversing Layers of Stars, by Cecilia H. Payne. The Astrophysical Journal 64, 204. doi:10.1086/143003
- 5Morgan, W. W. and Keenan, P. C. (1973). Spectral Classification. Annual Review of Astronomy and Astrophysics 11, 29-50. doi:10.1146/annurev.aa.11.090173.000333
- 6Gray, R. O. and Corbally, C. J. (2009). Stellar Spectral Classification. Princeton University Press. doi:10.1515/9781400833368
- 7Mamajek, E. E.. A Modern Mean Dwarf Stellar Color and Effective Temperature Sequence (version 2022.04.16). www.pas.rochester.edu/~emamajek/EEM_dwarf_UBVIJHK_colors_Teff.txt
- 8Pecaut, M. J. and Mamajek, E. E. (2013). Intrinsic Colors, Temperatures, and Bolometric Corrections of Pre-main-sequence Stars. The Astrophysical Journal Supplement Series 208, 9. doi:10.1088/0067-0049/208/1/9
- 9Kirkpatrick, J. D. et al. (1999). Dwarfs Cooler than "M": The Definition of Spectral Type "L" Using Discoveries from the 2 Micron All-Sky Survey (2MASS). The Astrophysical Journal 519, 802-833. doi:10.1086/307414
- 10Kirkpatrick, J. D. (2005). New Spectral Types L and T. Annual Review of Astronomy and Astrophysics 43, 195-245. doi:10.1146/annurev.astro.42.053102.134017
- 11Cushing, M. C. et al. (2011). The Discovery of Y Dwarfs Using Data from the Wide-field Infrared Survey Explorer (WISE). The Astrophysical Journal 743, 50. doi:10.1088/0004-637X/743/1/50
- 12Morgan, W. W., Keenan, P. C. and Kellman, E. (1943). An Atlas of Stellar Spectra, with an Outline of Spectral Classification. University of Chicago Press.
- 13Keenan, P. C. and McNeil, R. C. (1989). The Perkins catalog of revised MK types for the cooler stars. The Astrophysical Journal Supplement Series 71, 245. doi:10.1086/191373
- 14Gaia Collaboration et al. (2018). Gaia Data Release 2: Observational Hertzsprung-Russell diagrams. Astronomy & Astrophysics 616, A10. doi:10.1051/0004-6361/201832843
- 15Harre, J. V. and Heller, R. (2021). Digital color codes of stars. Astronomische Nachrichten 342, 578-587. doi:10.1002/asna.202113868
- 16Reylé, C. et al. (2021). The 10 parsec sample in the Gaia era. Astronomy & Astrophysics 650, A201. doi:10.1051/0004-6361/202140985
- 17Henry, T. J. et al. (2018). The Solar Neighborhood XLIV: RECONS Discoveries within 10 parsecs. The Astronomical Journal 155, 265. doi:10.3847/1538-3881/aac262