- On this page
- 2
- figures
- 1
- table
- 2
- panels
- 19
- references
Galaxy
Milky Way
ContentsShow
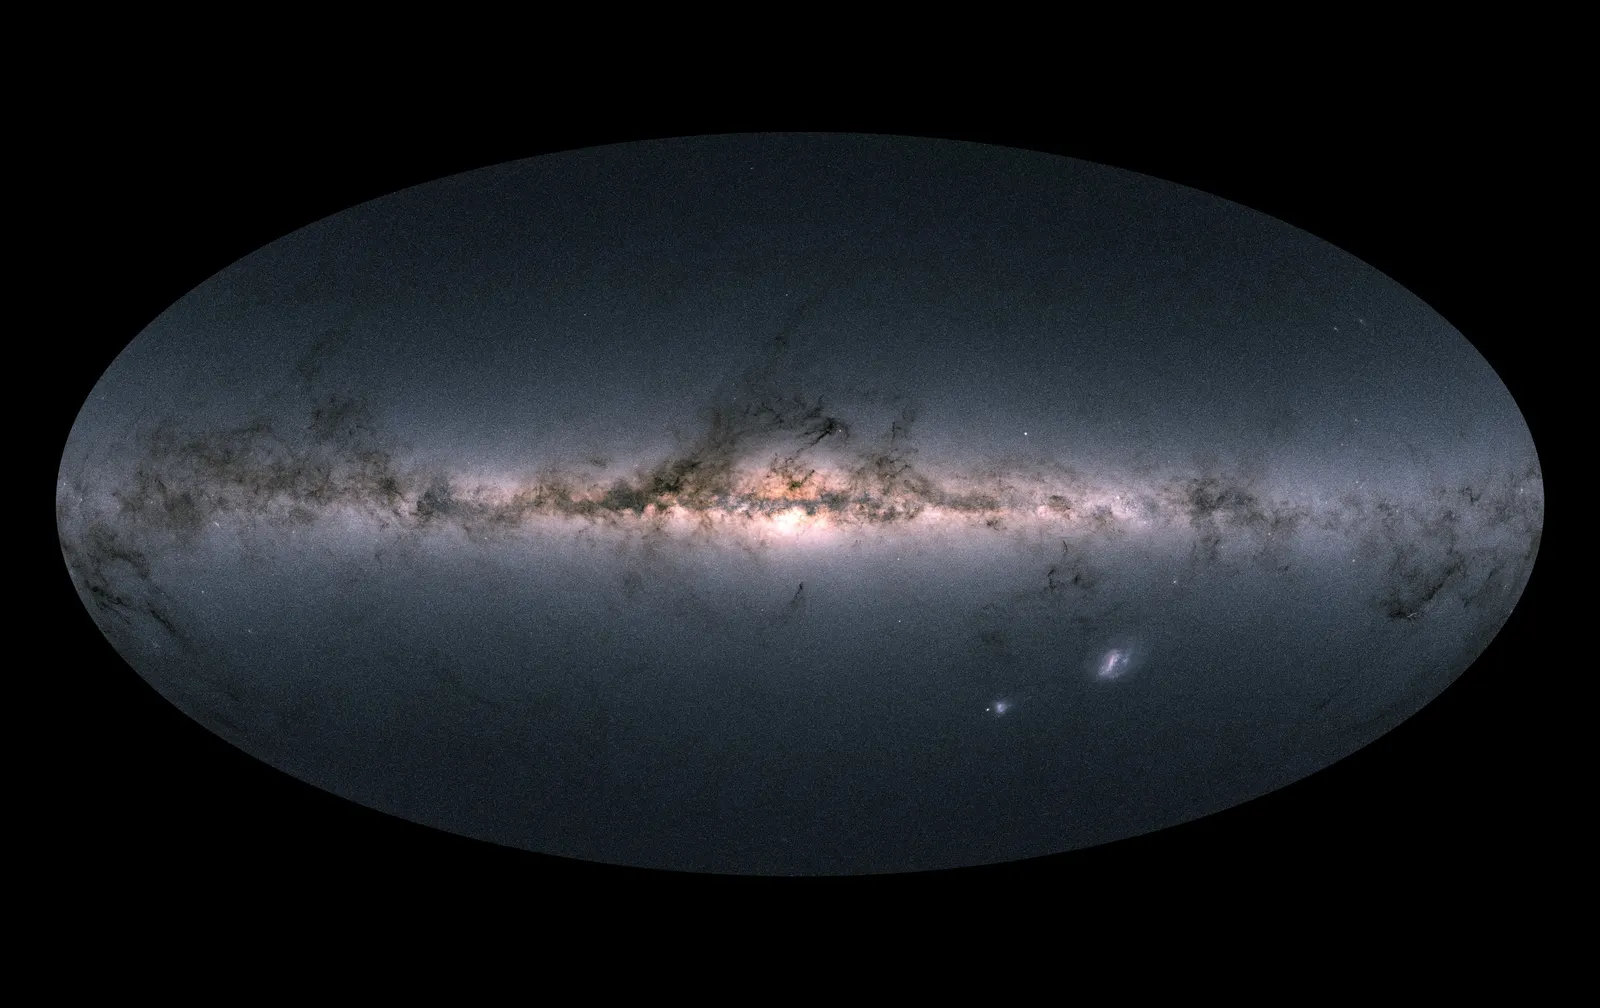
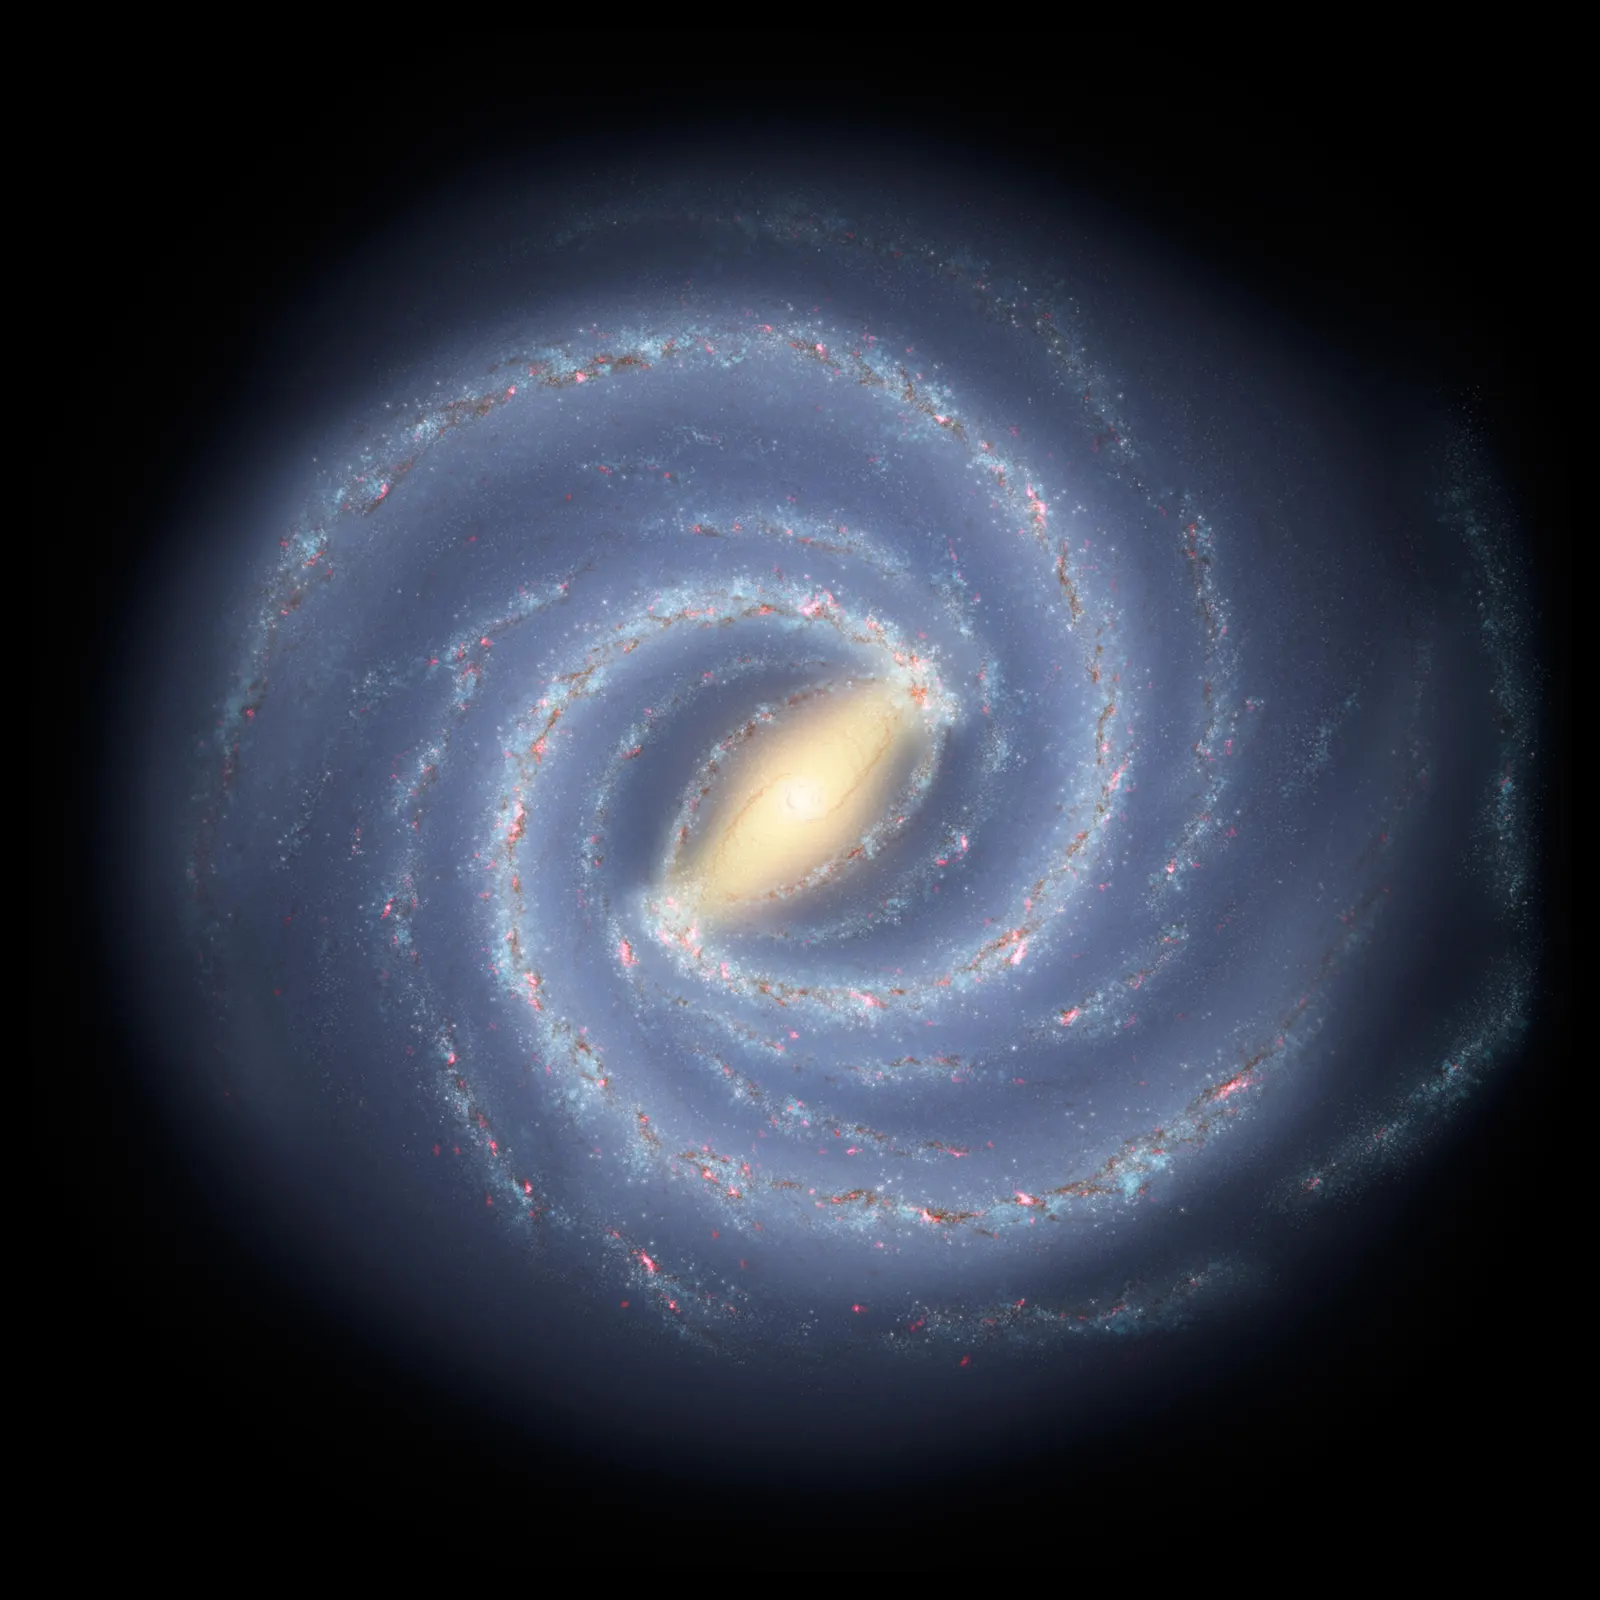
The Milky Way is the galaxy that contains the Sun: a flattened, rotating system of 100 to 400 billion stars, gas, dust and dark matter, shaped as a barred spiral whose bright disk is about 30 kiloparsecs (roughly 100,000 light years) across. The Sun sits in that disk about 8.2 kiloparsecs from the centre, just above the midplane, so we see the Galaxy edge-on from inside it, as the pale band across the night sky that gave it its name. Every star in Pax Abyssi belongs to it, and the game's generated sky beyond the real catalogue is built from a published model of its structure.
Structure
A galaxy seen from inside cannot be photographed whole, so its shape is assembled from counts, motions and distances of stars in every direction. The modern picture has six stellar components plus a dark matter halo. 1
| Component | Size and shape | Stellar mass (solar masses) | Main source |
|---|---|---|---|
| Thin disk | exponential, scale length about 2.6 kpc, scale height about 300 pc | about 3.5 x 10^10 | 2 1 |
| Thick disk | scale length about 3.6 kpc, scale height about 900 pc, older and more metal-poor | about 6 x 10^9 | 2 1 |
| Bar and boxy bulge | a peanut-shaped bar about 27 to 28 degrees from the Sun-centre line | 1.88 x 10^10 | 3 4 |
| Nuclear stellar disk | a dense, flattened disk in the central few hundred parsecs, around a nuclear star cluster a few parsecs across | 1.05 x 10^9 (disk) | 5 |
| Stellar halo | a roughly spheroidal cloud of old stars reaching past 100 kpc | 1.4 x 10^9 | 6 |
| Central black hole | Sagittarius A* | about 4.3 x 10^6 | 7 |
Most of the Galaxy's stars live in the thin disk. Its density falls off exponentially with distance from the centre and with height above the midplane, which star counts describe well with a double exponential:
Here is the number of stars per cubic parsec at the Sun, is the distance from the Galactic centre measured in the plane, is the height above it, kpc is the scale length and pc the scale height for old stars. 2 The formula has a direct reading. Walk 2.6 kpc toward the centre and the stars crowd together by a factor of ; climb 300 pc out of the plane and they thin out by the same factor. Near the Sun there are about 0.1 stars in every cubic parsec, one star per box ten light years on a side. Young, hot stars hug the plane much more tightly than old ones: O and B stars have scale heights of only a few tens of parsecs, because they have not lived long enough to be scattered upward.
The bar is the Galaxy's dominant inner structure. Red clump giants, stars of nearly fixed brightness that serve as distance markers, show a boxy, X-shaped bulge that is really the thickened inner part of a long bar tilted about 27 degrees to our line of sight. 3 Dynamical models fitted to the stars' counts and motions give the whole bar and bulge a stellar mass of solar masses, about a third of all the Galaxy's stars by mass. 4 Its density has since been captured in a closed-form analytic fit. 8
The spiral arms are best traced by the youngest objects. Radio astronomers have measured trigonometric parallaxes to about 200 massive star-forming regions using masers, natural microwave lasers in dense gas, and fitted arms through them: Norma, Scutum-Centaurus, Sagittarius-Carina, Perseus, the Outer arm and the short Local arm near the Sun. 9 Old stars barely follow the arms: the surface density of mass differs between arm and inter-arm regions by only about ten percent either way at the Sun's radius. 10 The arms are patterns that young stars light up, and most of the Galaxy's mass passes through them.
The stellar halo holds only about 1.4 billion solar masses of old, metal-poor stars. Its mass and average metallicity point to one massive dwarf galaxy that merged with the Milky Way about 10 billion years ago and now dominates the inner halo. 6 Around it lies a far more massive halo of dark matter, which makes up most of the Galaxy's total mass of roughly solar masses. 1
How many stars
The number of stars is less certain than the mass in stars, because the faintest stars are the most common. Estimates of the total stellar mass cluster around to solar masses. 1 11 12 Dividing by the mass of an average star gives a count:
With solar masses and an average star of 0.4 solar masses, . If red dwarfs below a fifth of a solar mass are more numerous than assumed, the average falls toward 0.15 solar masses and the count rises past 300 billion. That is why the literature quotes a range of 100 to 400 billion rather than a single figure.
The Sun's place
The distance from the Sun to the Galactic centre, , sets the scale of every Galactic model. The most direct measurement comes from the star S2, which orbits the central black hole every 16 years: comparing its motion across the sky with its line-of-sight velocity gives a geometric distance. The GRAVITY instrument at ESO's Very Large Telescope Interferometer measured pc in 2019 and, after correcting an optical aberration, pc in 2021. 13 14 A value of 8.2 to 8.3 kpc, about 27,000 light years, covers both. The Sun also sits pc above the midplane. 15
Stars and gas near the Sun circle the centre at about 229 km/s, measured from the motions of red giant stars; maser parallaxes give a similar 236 ± 7 km/s. 16 9 One lap of about 52 kpc at that speed takes
so the Sun has made about 20 orbits since it formed. The rotation curve stays nearly flat out to 25 kpc, declining only slowly. 16 If the visible stars and gas were all the mass there is, orbital speeds would fall off steeply beyond the disk. They do not, and that is one of the main lines of evidence for dark matter.
How we know
- Star counts. The Sloan Digital Sky Survey counted 48 million stars at known colours and magnitudes, enough to fit the thin disk, thick disk and halo together. 2
- Infrared surveys. Dust hides the inner Galaxy at visible wavelengths but lets near-infrared light through, which is how the bar was mapped with red clump giants. 3
- Maser parallaxes. Radio interferometers spanning continents measure parallaxes to about ten microarcseconds, accurate enough to place star-forming regions on the far side of the Galactic centre. 9
- Gaia. ESA's astrometry mission measured positions for about 1.8 billion sources and parallaxes for about 1.5 billion in its third data release (2022), giving distances and motions across a large part of the disk. 17
- Stellar ages. Combining Gaia with spectroscopic surveys dates subgiant stars individually. They show that the old, thick disk began forming about 13 billion years ago, only 0.8 billion years after the Big Bang. 18
- Stars around the central black hole. Decades of orbits around Sagittarius A* give both its mass, about 4.3 million solar masses, and the Sun's distance from it. 7
See also
- Sagittarius A*, the black hole at the centre
- Star catalogue, the 119,626 real stars in the game
- Sol, the Solar System
- Stellar classification
- Red dwarf, the most common kind of star
- Neutron star and Black hole
- Science in Pax Abyssi
References
- 1Bland-Hawthorn, J. and Gerhard, O. (2016). The Galaxy in Context: Structural, Kinematic, and Integrated Properties. Annual Review of Astronomy and Astrophysics 54, 529-596. doi:10.1146/annurev-astro-081915-023441
- 2Juric, M. and et al. (2008). The Milky Way Tomography with SDSS. I. Stellar Number Density Distribution. The Astrophysical Journal 673, 864-914. doi:10.1086/523619
- 3Wegg, C. and Gerhard, O. (2013). Mapping the three-dimensional density of the Galactic bulge with VVV red clump stars. Monthly Notices of the Royal Astronomical Society 435, 1874-1887. doi:10.1093/mnras/stt1376
- 4Portail, M. et al. (2017). Dynamical modelling of the galactic bulge and bar: the Milky Way's pattern speed, stellar and dark matter mass distribution. Monthly Notices of the Royal Astronomical Society 465, 1621-1644. doi:10.1093/mnras/stw2819
- 5Sormani, M. C. et al. (2022). Self-consistent modelling of the Milky Way's nuclear stellar disc. Monthly Notices of the Royal Astronomical Society 512, 1857-1884. doi:10.1093/mnras/stac639
- 6Deason, A. J., Belokurov, V. and Sanders, J. L. (2019). The total stellar halo mass of the Milky Way. Monthly Notices of the Royal Astronomical Society 490, 3426-3439. doi:10.1093/mnras/stz2793
- 7GRAVITY Collaboration, Abuter, R. and et al. (2022). Mass distribution in the Galactic Center based on interferometric astrometry of multiple stellar orbits. Astronomy & Astrophysics 657, L12. doi:10.1051/0004-6361/202142465
- 8Sormani, M. C. et al. (2022). The stellar mass distribution of the Milky Way's bar: an analytical model. Monthly Notices of the Royal Astronomical Society Letters 514, L1-L5. doi:10.1093/mnrasl/slac046
- 9Reid, M. J. and et al. (2019). Trigonometric Parallaxes of High-mass Star-forming Regions: Our View of the Milky Way. The Astrophysical Journal 885, 131. doi:10.3847/1538-4357/ab4a11
- 10Eilers, A. C. et al. (2020). The Strength of the Dynamical Spiral Perturbation in the Galactic Disk. The Astrophysical Journal 900, 186. doi:10.3847/1538-4357/abac0b
- 11Licquia, T. C. and Newman, J. A. (2015). Improved Estimates of the Milky Way's Stellar Mass and Star Formation Rate from Hierarchical Bayesian Meta-Analysis. The Astrophysical Journal 806, 96. doi:10.1088/0004-637X/806/1/96
- 12McMillan, P. J. (2017). The mass distribution and gravitational potential of the Milky Way. Monthly Notices of the Royal Astronomical Society 465, 76-94. doi:10.1093/mnras/stw2759
- 13GRAVITY Collaboration, Abuter, R. and et al. (2019). A geometric distance measurement to the Galactic center black hole with 0.3% uncertainty. Astronomy & Astrophysics 625, L10. doi:10.1051/0004-6361/201935656
- 14GRAVITY Collaboration, Abuter, R. and et al. (2021). Improved GRAVITY astrometric accuracy from modeling optical aberrations. Astronomy & Astrophysics 647, A59. doi:10.1051/0004-6361/202040208
- 15Bennett, M. and Bovy, J. (2019). Vertical waves in the solar neighbourhood in Gaia DR2. Monthly Notices of the Royal Astronomical Society 482, 1417-1425. doi:10.1093/mnras/sty2813
- 16Eilers, A. C. et al. (2019). The Circular Velocity Curve of the Milky Way from 5 to 25 kpc. The Astrophysical Journal 871, 120. doi:10.3847/1538-4357/aaf648
- 17Gaia Collaboration, Vallenari, A. and et al. (2023). Gaia Data Release 3: Summary of the content and survey properties. Astronomy & Astrophysics 674, A1. doi:10.1051/0004-6361/202243940
- 18Xiang, M. and Rix, H. W. (2022). A time-resolved picture of our Milky Way's early formation history. Nature 603, 599-603. doi:10.1038/s41586-022-04496-5
- 19Hunter, G. H. and et al. (2024). Testing kinematic distances under a realistic Galactic potential. Astronomy & Astrophysics 692, A216. doi:10.1051/0004-6361/202450000