Where the catalogue ends
The sky in Pax Abyssi begins with 119,626 stars that astronomers have measured one by one. A few hundred light years out, that list thins to almost nothing, and the Milky Way's other hundred billion stars have to come from a model. This is how the model is built, and why the measured stars and the modelled ones have to add up.
By Pax Abyssi Science Desk

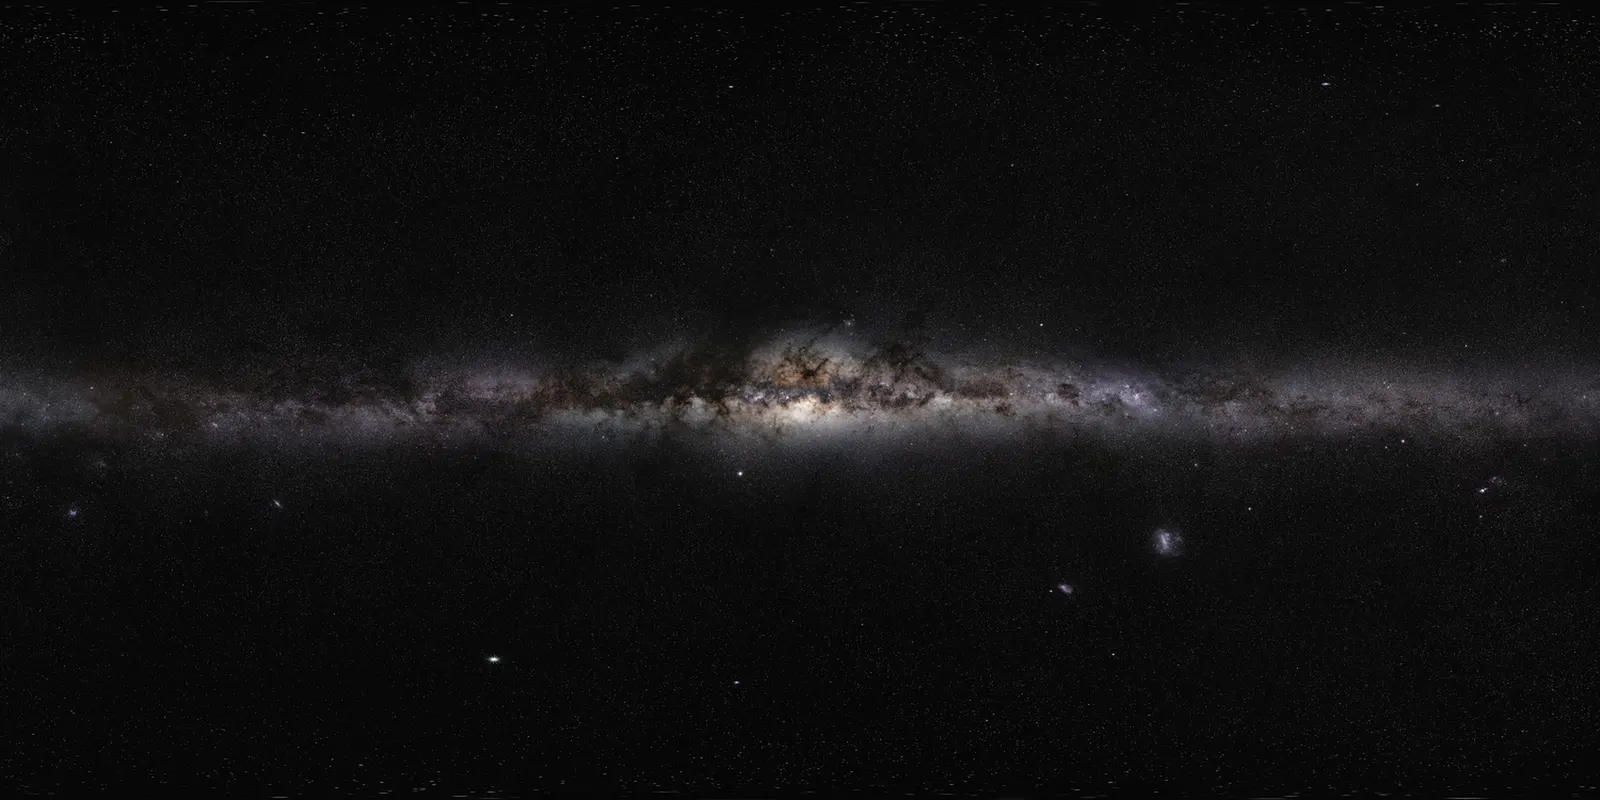
The whole sky as the Gaia spacecraft saw it: the combined brightness and colour of about 1.8 billion stars from its Early Data Release 3 (2020), in Galactic coordinates with the centre of the Milky Way in the middle. Observation. Credit: ESA/Gaia/DPAC; CC BY-SA 3.0 IGO. Acknowledgement: A. Moitinho.
ESA/Gaia/DPAC; CC BY-SA 3.0 IGO. Acknowledgement: A. Moitinho.CC BY-SA 3.0 IGO
Point the ship's nose at Virgo and the brightest star in that part of the sky is Spica, a pair of hot blue stars about 250 light years away. Pax Abyssi draws it where astronomers have measured it to be, as bright as it looks from Earth. The same is true of all 5,070 stars in the game's naked-eye sky, and of the other 114,000 or so on its galaxy map: each is a row in a catalogue whose backbone was measured by a European satellite launched in 1989.
The catalogue is the easy part. The Milky Way holds somewhere between 100 billion and 400 billion stars, the range depending mostly on how many faint dwarfs there are, and the catalogue holds one in a million of them or fewer. A galaxy that a player can cross needs the rest, placed where real stars would be, in the right kinds and the right numbers. Nobody has catalogued them, so they cannot be looked up. They have to be inferred, and the inference is only as good as the model behind it.
A list of measured stars
The Pax Abyssi catalogue starts from the HYG database, a compilation maintained by David Nash that merges three older lists 1. The largest is the Hipparcos Catalogue, the work of an ESA satellite that measured the positions and distances of 118,218 stars between 1989 and 1993 2. The others are the Yale Bright Star Catalogue and the Gliese catalogue of stars near the Sun, which adds faint neighbours that Hipparcos could not see.
What makes the game's version its own is a set of corrections laid on top, each in a new column so that no original value is ever overwritten. Spectral types, the letters and numerals that sort stars by temperature and size, have been checked against each star's measured colour and brightness and corrected or completed on 75,529 rows. The Extended Hipparcos Compilation, XHIP, adds metallicities for 19,097 stars and ages for 12,921 3. And 97,962 rows carry a distance from Gaia's third data release 4.
Gaia's distances repaired a real hole. Where a Hipparcos parallax was zero, negative or too uncertain to use, HYG gives the star a placeholder distance of 100,000 parsecs, well outside the Galaxy. That affected 10,225 rows, 8.5 per cent of the catalogue. One of them, a giant star of type K0 in Cetus, was listed with the brightness of 2.6 million Suns; Gaia puts it at 415 parsecs, shining like 45. Gaia rescued 9,053 of the lost stars. For 1,170 more, which Gaia's cross-match missed, the distance is estimated from the star's type and apparent brightness and flagged as an estimate. Two could not be placed at all.
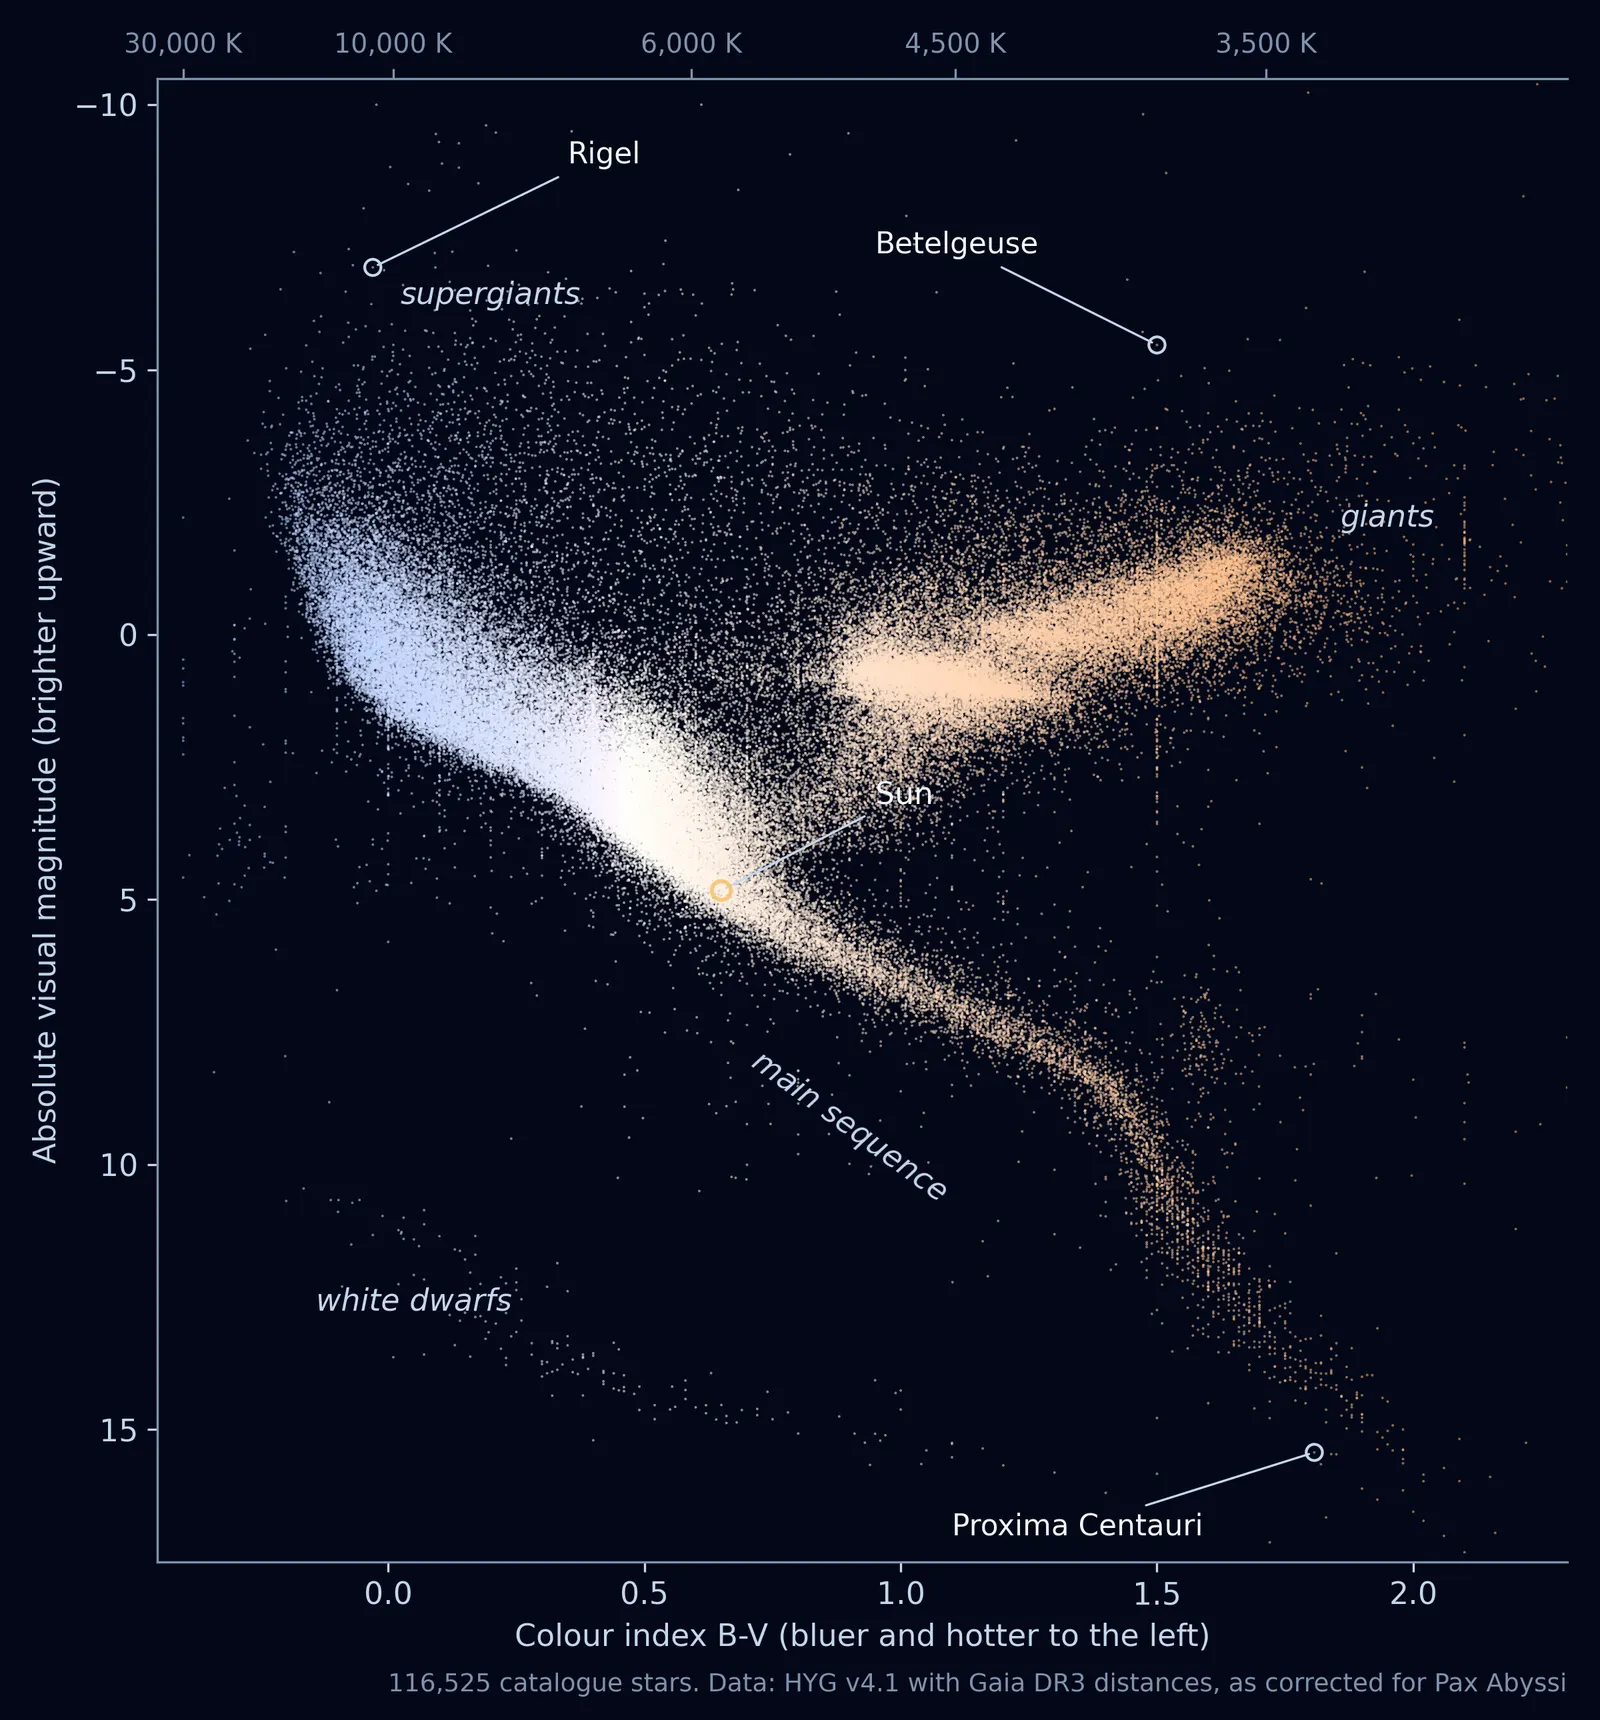
The result, drawn as a Hertzsprung-Russell diagram, shows every major kind of star, with the main sequence of hydrogen-burning stars running diagonally across it and the giants clumped above.
Where the list runs out
The diagram hides a bias. A catalogue like this one is limited by brightness: a luminous star makes the list from hundreds of parsecs away, while a dim one makes it only if it is close. The faint stars are also the common ones. So the further out you look, the more of the real population is missing, and what remains is a skewed sample of the Galaxy's showpieces.
The figure below measures how skewed. Within 10 parsecs, about 33 light years, the catalogue holds 338 stars, about 86 per cent of the number the Milky Way model described below says should be there. Within 25 parsecs it has about 3,000 stars, where the most complete modern list of nearby stars, the Fifth Catalogue of Nearby Stars, holds about 5,200 8 and the model expects about 6,000. Within 80 parsecs, 260 light years, the catalogue has 9 per cent of the model's stars; within 1,000 parsecs, less than a tenth of 1 per cent.
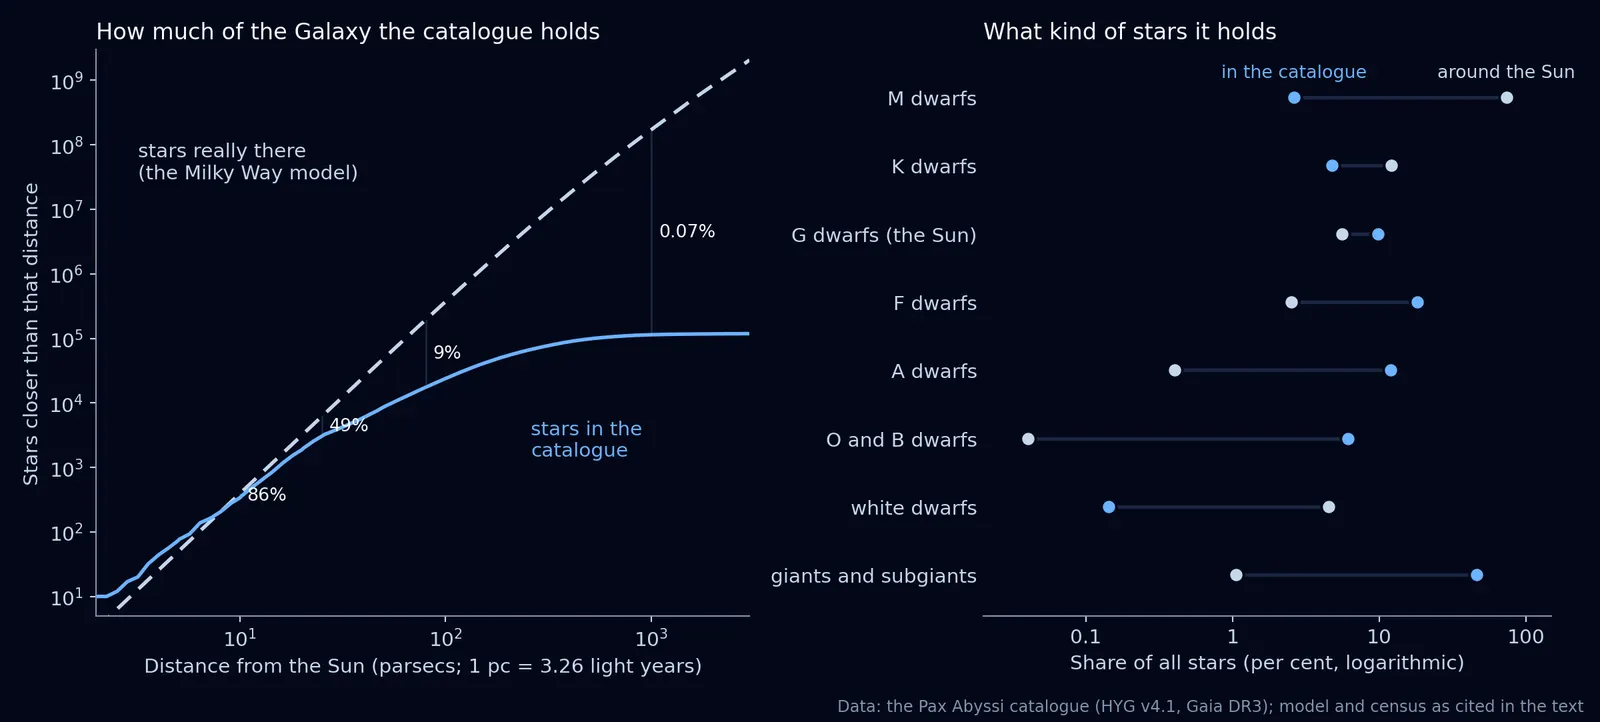
The right-hand panel shows who is missing. Around the Sun, nearly three stars in four are M dwarfs, the small, cool, dim stars called red dwarfs; in the catalogue they are about one in forty. White dwarfs, the cooling remnants of stars like the Sun, are about one star in twenty nearby and about one in seven hundred in the list. The balance is made up by rarities. O and B stars, the hot, massive blue stars of the main sequence, are four in every ten thousand stars around the Sun but six in every hundred catalogue entries, and giants and subgiants, about one star in a hundred locally, fill nearly half the catalogue.
Any list assembled by looking is skewed this way, and the skew sets the problem. Out to a few tens of parsecs the catalogue is the Galaxy. Past a few hundred parsecs it is a thin scattering of bright stars against a population that has to be supplied.
Rebuilding the Milky Way from its parts
The model that supplies it is a sum of published components, each taken from the paper that measured it, placed in a frame centred on the Galaxy's central black hole, Sagittarius A*. The Sun sits 8,275 parsecs from it, the distance measured by the GRAVITY instrument from stars orbiting the black hole 9, and 20.8 parsecs above the Galaxy's midplane 10.
The thin disk holds most of the stars near the Sun. Its density falls off by a factor of e, about 2.7, every 2,600 parsecs outward and every 300 parsecs upward for old stars, the numbers fitted by Mario Jurić and colleagues to 48 million stars counted by the Sloan Digital Sky Survey 11. The thick disk, an older, puffier population, adds 12 per cent to the density in the midplane with a scale height of 900 parsecs. Young stars get their own, much thinner layers: the scale height of the O and B stars is about 34 parsecs 12, of A stars about 51 and of F stars about 90 13.
At the centre sits the bar, a long, boxy structure about 10 kiloparsecs from end to end, tilted 28 degrees to our line of sight. Its shape comes from an analytic fit by Mattia Sormani and colleagues 14 to a dynamical model of the bulge built to match the counts and motions of its red giant stars 15. It weighs 18 billion solar masses and holds about half of all the model's stars, because it is old and dense. Inside it are a nuclear disk and a nuclear star cluster; outside everything is a faint, flattened halo of old stars weighing 1.4 billion solar masses 16.
The spiral arms come from about 200 parallaxes of masers, natural microwave lasers in the gas around newborn massive stars, which trace four arms with extra segments and spurs 17. Those measurements cover about a third of the disk; beyond them the model uses the symmetric arms of a whole-Galaxy model by Hunter and colleagues 18. How strongly a class of star follows the arms depends on its age. The young O and B stars are born in the arms and never leave them. Old stars have had billions of years to wander, and their density varies by only about 10 per cent between arm and gap 19. Beyond the Sun the disk flares thicker 20, and at its edges it warps, rising on one side and dipping on the other, as young pulsating stars called Cepheids reveal 21.
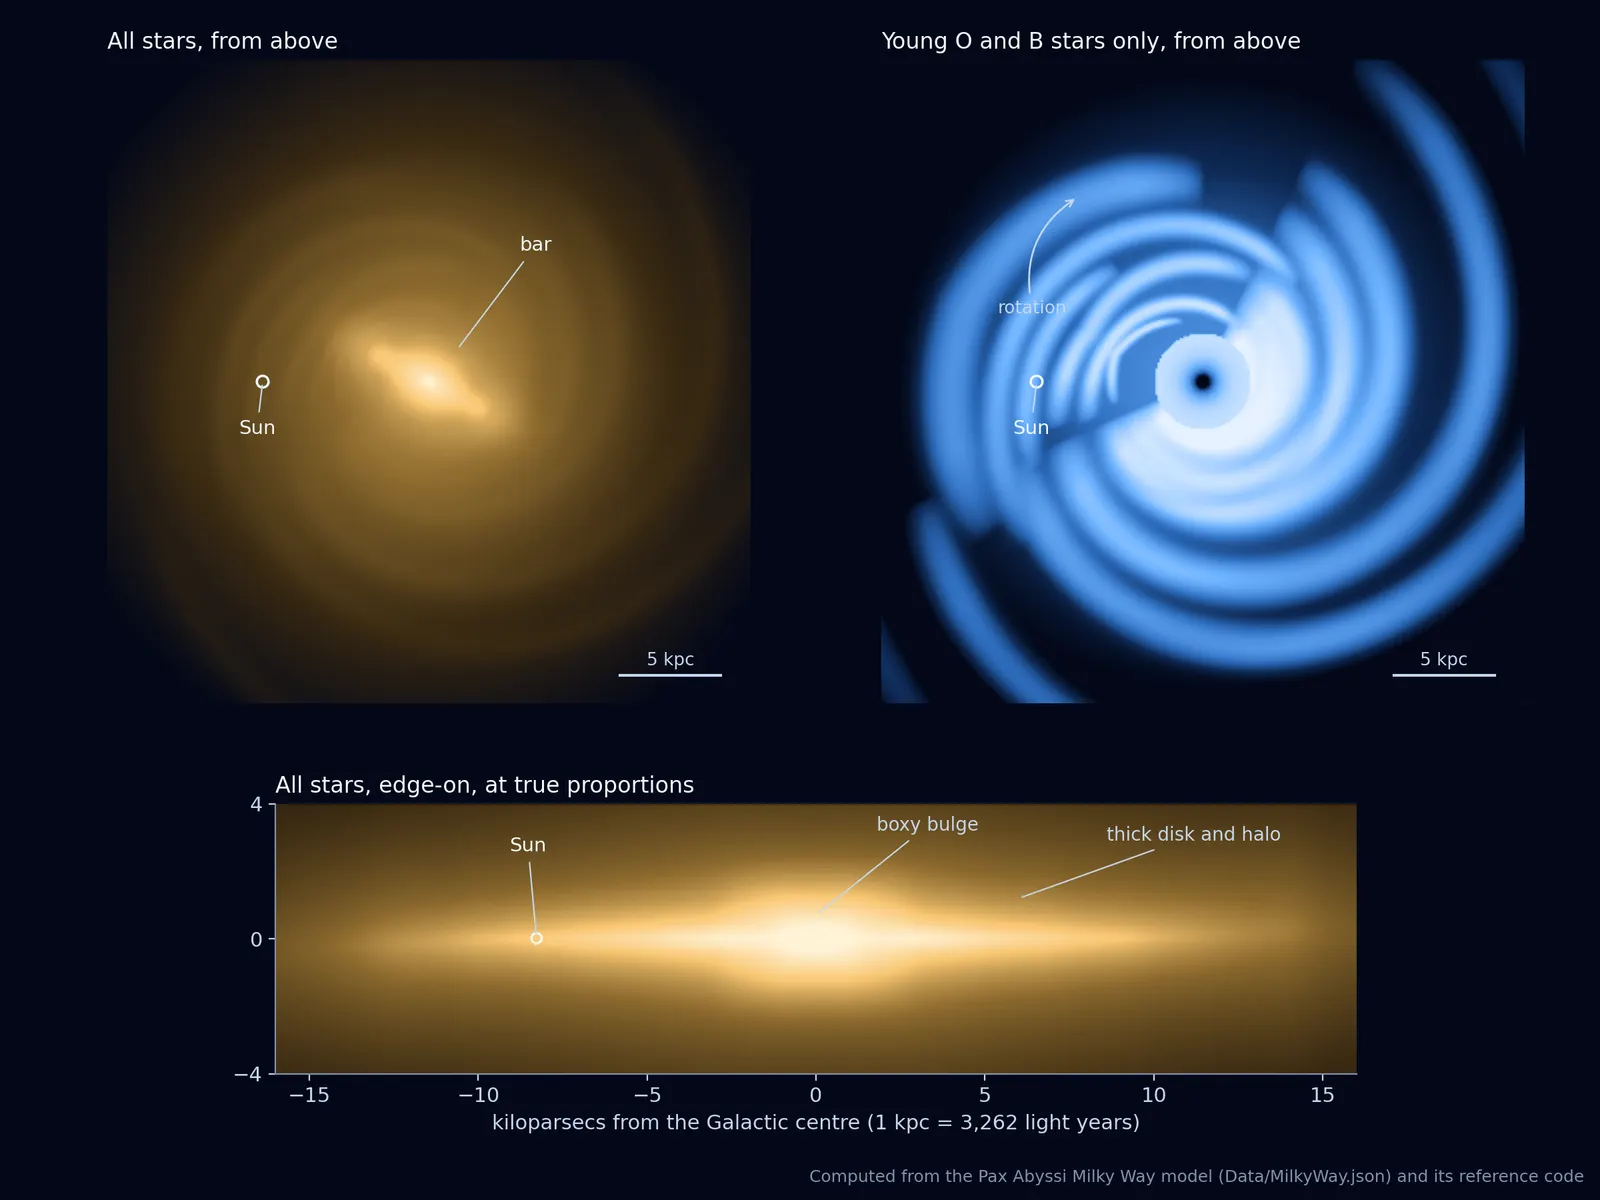
The whole model is pinned to one measured number: 0.10 stars per cubic parsec in the midplane beneath the Sun, the density counted in the census of stars within 10 parsecs, rounded up slightly for the faint stars still being found 22 23. Every class of star has its own local share from that census. From there the model gives 111 billion stars, 22 billion brown dwarfs, about 840 million neutron stars 24 and about 87 million black holes 25. The numbers range enormously with place. The densest cube the generator will handle, 1.9 parsecs on a side at the heart of the nuclear star cluster, holds 1.8 million stars. A cube of the same size around the Sun holds fewer than one.
Adding up the real and the generated
The obvious way to combine a catalogue with a model is to generate the model's stars and then delete any that land near a real one. It is also wrong. A generated star and a catalogued star in the same patch of sky are not the same star, and subtracting one list from another in patches leaves some regions with too many stars and others with too few.
Pax Abyssi uses a method from probability instead, called thinning. The model says how many stars of each kind a region should hold. Each would-be star is then kept only with the probability that Earth's catalogue would have missed it, judged from its own brightness as seen from the Sun, dimmed by the dust along the way 30. That probability is measured from the catalogue itself, which holds roughly nine stars in ten of apparent magnitude 7, half of those of magnitude 8 and one in ten at magnitude 9.
Take an orange dwarf like 61 Cygni A, with an absolute magnitude of about 7.5, and place it 150 parsecs away. It would appear at magnitude 13, far too faint for the catalogue, so the model's star is kept: it is one Earth has not listed. Place a B star there instead, and it would shine at magnitude 5, bright enough that the catalogue certainly holds the real one, so the model's copy is almost always dropped. A standard result for random scatterings of points, known as Poisson thinning, guarantees that the survivors are distributed exactly as the uncatalogued stars should be. Catalogue plus generated stars add up to the true count, with no list subtracted from another.
The same bookkeeping makes the model honest about its own inputs. Its first rate for Wolf-Rayet stars, hot, massive stars shedding their outer layers, came from the handful in the catalogue within a kiloparsec, and implied almost 9,000 in the Galaxy. Several of those stars turned out to have Hipparcos parallaxes that put distant stars at a few dozen parsecs. A survey of the Galactic Wolf-Rayet population puts the real total near 1,200 31, and the rate was corrected to match.
A generated star is drawn only if Earth would not have catalogued it, so the real and the generated add up to the true count.
The galaxy that was tilted
Building the model on firm foundations meant auditing the one it replaced, and the audit, in September 2026, found an error that had been hiding in plain sight.
The star catalogue gives each star's position as x, y and z in parsecs from the Sun, measured in the equatorial frame: z points at the north celestial pole, the point in the sky above Earth's North Pole, and the x-y plane is the celestial equator, Earth's own equator projected onto the sky. Nothing about that frame has to do with the Galaxy. Earth's axis happens to be tilted 62.9 degrees to the axis of the Milky Way's disk. The procedural fill that Pax Abyssi inherited from its predecessor, the Python simulation it grew from, had treated the catalogue's x-y plane as the Galactic plane.
The consequences were large. The generated disk was tilted 62.9 degrees through the real sky. The model's Galactic centre was placed toward right ascension 0 hours, declination 0, in the direction of Pisces and Cetus, which is 60 degrees below the real Galactic plane; in true Galactic terms the generated bulge sat about 7 kiloparsecs below the disk, in the halo. A kiloparsec from the Sun, the generated midplane could lie 890 parsecs from the real one, filling regions of real sky that hold a twentieth of the stars with a full disk's worth, while the crowded real plane through Cygnus, Carina and Sagittarius ran out of the model's layer.
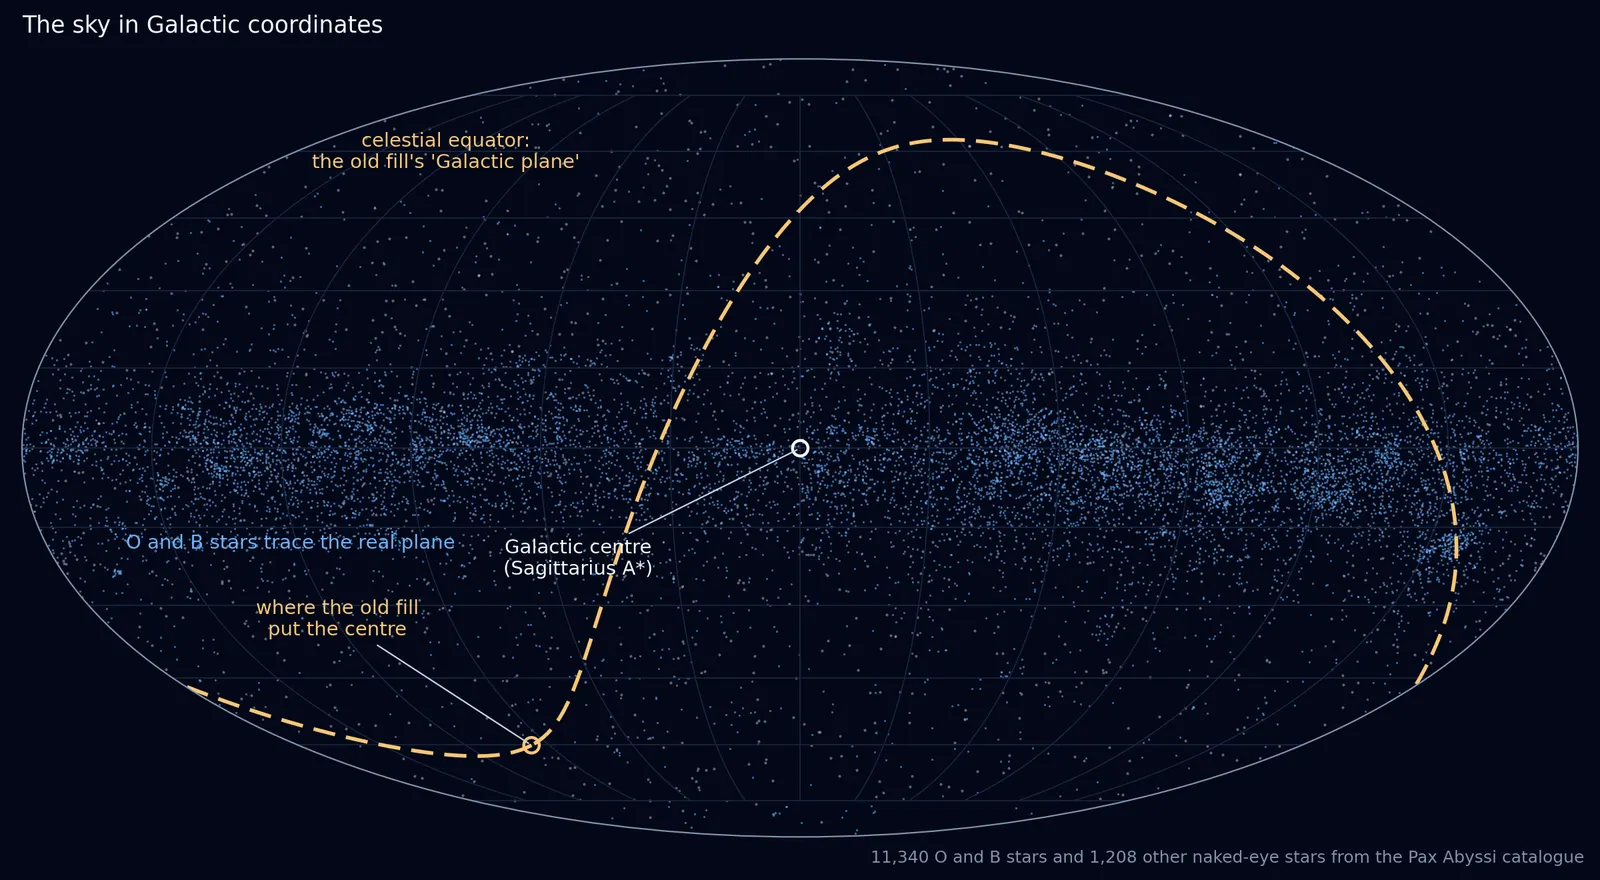
It went unnoticed because it hardly shows where anyone looks. Within 100 parsecs of the Sun the two planes are never more than 89 parsecs apart, a density error of about a quarter, and in that volume the real catalogue stars dominate anyway. The error grows with distance, to two and a half times too many stars at 300 parsecs and ten to twenty times at a kiloparsec. The audit found it by asking which frame the coordinates were in, then measuring where the pole of the Galaxy falls among them: 62.9 degrees from the catalogue's z axis, where the old code had assumed it lay.
The fix is a rotation. Every catalogue row and every known object is now converted once from the equatorial frame to the Galactic one, using the rotation that defines Galactic coordinates in the Hipparcos Catalogue 32, then shifted by the Sun's measured distance from the centre and height above the midplane. The test is that Sagittarius A* itself, a row in the list of known objects, lands at the model's origin. It does, to within 2 parsecs, the difference between two of GRAVITY's own distance measurements. On the way, the same check caught a smaller slip: the model had first been centred on the point where Galactic longitude and latitude are both zero, which lies 4.3 arcminutes from the black hole, a miss of 10.6 parsecs at the Galactic centre, inside a star cluster only a few parsecs across. That was corrected too.
The audit found other faults in the old fill. Its density had been read from an artist's picture of a spiral galaxy, registered 2.6 kiloparsecs off its own centre. A hard limit of 512 objects per cube had silently discarded about 290,000 faint stars near the centre, and companions in binary systems were counted twice. The rebuild replaces the picture with the published components, removes the cap and counts each star of a multiple system once.
What you can see today
The model is written, and so is the code that places the stars. The frame and the density model run in the game's own C++, held to a Python reference implementation by automated tests to one part in a billion, and the generator that turns densities into individual stars, with dust dimming them, is written and under test. What is not finished is the view: the galaxy map that draws those generated stars, in their true numbers, at the limiting magnitude a player's zoom allows. That is in development, and until it is finished the generated Milky Way is not part of the game a player can explore.
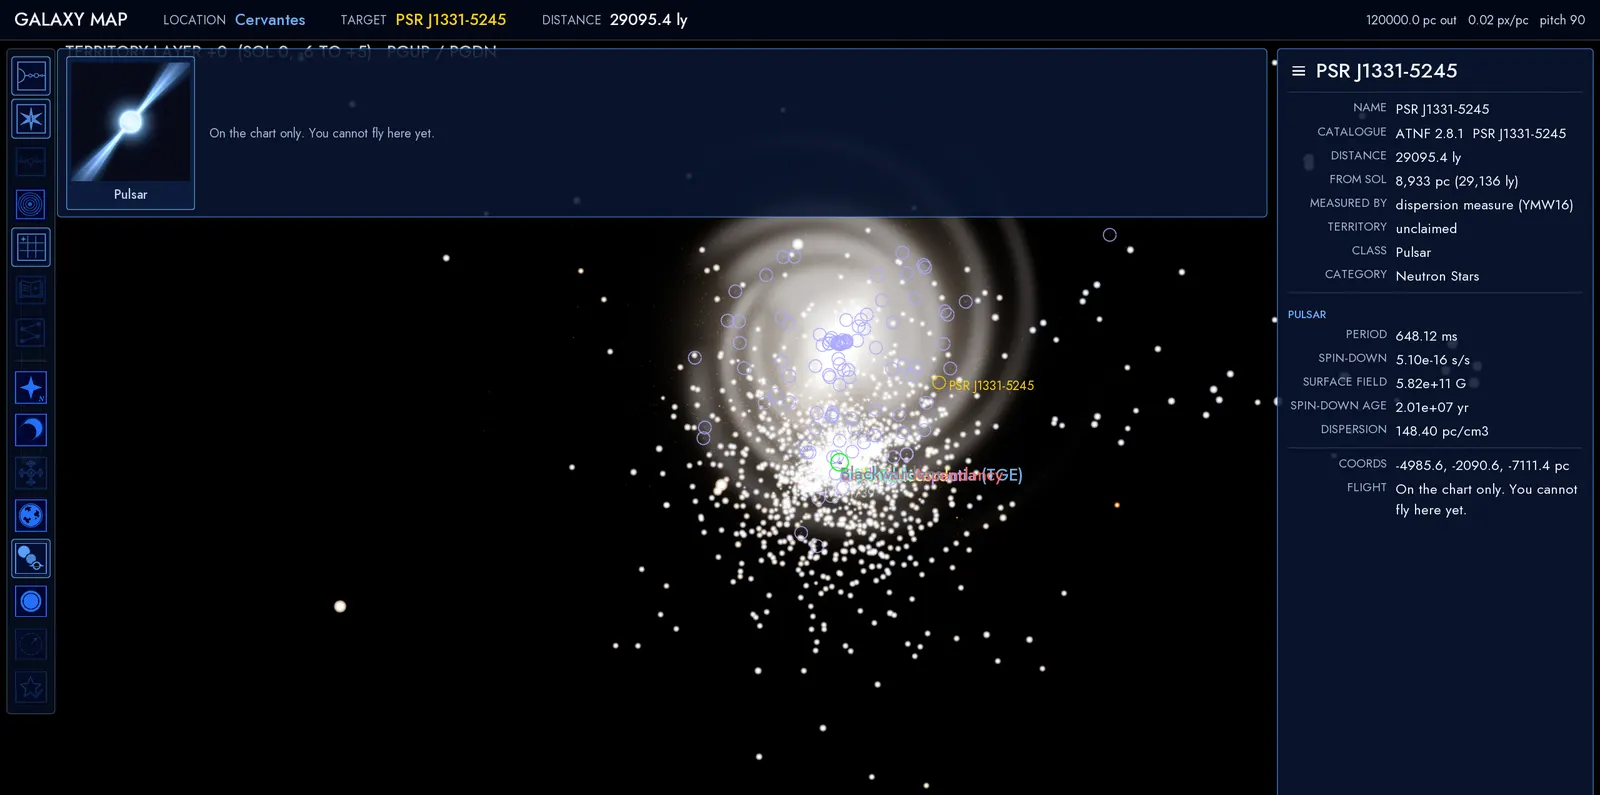
What is in the game now is the measured part. The cockpit sky shows the 5,070 catalogue stars brighter than magnitude 6, for the moment always as seen from the Sun, wherever the ship is; drawing the sky from another star is designed but not built. The galaxy map holds 119,624 catalogue stars and every compact object on the lists: the 4,393 pulsars of the ATNF Pulsar Catalogue 33, 375 other known neutron stars and 113 known black holes, each at its published distance. For many pulsars that distance comes from how much the interstellar electrons between us and the star have delayed the low radio frequencies of its pulses 34.
The measured part will grow on its own. Gaia's fourth data release, built on 66 months of observations against the 34 behind the current one, is due on 2 December 2026 35. Its distances will reach further and fainter than any catalogue before it, and every star a deeper list adds is one a model no longer has to invent. Thinning makes the exchange exact: fold a deeper catalogue in, measure its completeness again, and the generated population shrinks by precisely the stars it gained.
References
- 1Nash, D. (2025). The HYG Database. astronexus.com. www.astronexus.com/projects/hyg
- 2Perryman, M. A. C. and et al. (1997). The HIPPARCOS Catalogue. Astronomy & Astrophysics 323, L49-L52. ui.adsabs.harvard.edu/abs/1997A%26A...323L..49P
- 3Anderson, E. and Francis, C. (2012). XHIP: An extended Hipparcos compilation. Astronomy Letters 38, 331-346. doi:10.1134/S1063773712050015
- 4Gaia Collaboration, Vallenari, A. and et al. (2023). Gaia Data Release 3: Summary of the content and survey properties. Astronomy & Astrophysics 674, A1. doi:10.1051/0004-6361/202243940
- 5van Leeuwen, F. (2007). Validation of the new Hipparcos reduction. Astronomy & Astrophysics 474, 653-664. doi:10.1051/0004-6361:20078357
- 6Gaia Collaboration, Prusti, T. and et al. (2016). The Gaia mission. Astronomy & Astrophysics 595, A1. doi:10.1051/0004-6361/201629272
- 7ESA Gaia team. Gaia Data Release 3 (Gaia DR3). ESA Cosmos. www.cosmos.esa.int/web/gaia/dr3
- 8Golovin, A. et al. (2023). The Fifth Catalogue of Nearby Stars (CNS5). Astronomy & Astrophysics 670, A19. doi:10.1051/0004-6361/202244250
- 9GRAVITY Collaboration, Abuter, R. and et al. (2021). Improved GRAVITY astrometric accuracy from modeling optical aberrations. Astronomy & Astrophysics 647, A59. doi:10.1051/0004-6361/202040208
- 10Bennett, M. and Bovy, J. (2019). Vertical waves in the solar neighbourhood in Gaia DR2. Monthly Notices of the Royal Astronomical Society 482, 1417-1425. doi:10.1093/mnras/sty2813
- 11Jurić, M. et al. (2008). The Milky Way Tomography with SDSS. I. Stellar Number Density Distribution. The Astrophysical Journal 673, 864-914. doi:10.1086/523619
- 12Maíz-Apellániz, J. (2001). The Spatial Distribution of O-B5 Stars in the Solar Neighborhood as Measured by Hipparcos. The Astronomical Journal 121, 2737-2742. doi:10.1086/320399
- 13Bovy, J. (2017). Stellar inventory of the solar neighbourhood using Gaia DR1. Monthly Notices of the Royal Astronomical Society 470, 1360-1387. doi:10.1093/mnras/stx1277
- 14Sormani, M. C. et al. (2022). The stellar mass distribution of the Milky Way's bar: an analytical model. Monthly Notices of the Royal Astronomical Society: Letters 514, L1-L5. doi:10.1093/mnrasl/slac046
- 15Portail, M. et al. (2017). Dynamical modelling of the galactic bulge and bar: the Milky Way's pattern speed, stellar and dark matter mass distribution. Monthly Notices of the Royal Astronomical Society 465, 1621-1644. doi:10.1093/mnras/stw2819
- 16Deason, A. J., Belokurov, V. and Sanders, J. L. (2019). The total stellar halo mass of the Milky Way. Monthly Notices of the Royal Astronomical Society 490, 3426-3439. doi:10.1093/mnras/stz2793
- 17Reid, M. J. et al. (2019). Trigonometric Parallaxes of High-mass Star-forming Regions: Our View of the Milky Way. The Astrophysical Journal 885, 131. doi:10.3847/1538-4357/ab4a11
- 18Hunter, G. H. et al. (2024). Testing kinematic distances under a realistic Galactic potential. Astronomy & Astrophysics 692, A216. doi:10.1051/0004-6361/202450000
- 19Eilers, A. C. et al. (2020). The Strength of the Dynamical Spiral Perturbation in the Galactic Disk. The Astrophysical Journal 900, 186. doi:10.3847/1538-4357/abac0b
- 20López-Corredoira, M. and Molgó, J. (2014). Flare in the Galactic stellar outer disc detected in SDSS-SEGUE data. Astronomy & Astrophysics 567, A106. doi:10.1051/0004-6361/201423706
- 21Chen, X. et al. (2019). An intuitive 3D map of the Galactic warp's precession traced by classical Cepheids. Nature Astronomy 3, 320-325. doi:10.1038/s41550-018-0686-7
- 22Reylé, C. et al. (2021). The 10 parsec sample in the Gaia era. Astronomy & Astrophysics 650, A201. doi:10.1051/0004-6361/202140985
- 23Henry, T. J. et al. (2018). The Solar Neighborhood XLIV: RECONS Discoveries within 10 parsecs. The Astronomical Journal 155, 265. doi:10.3847/1538-3881/aac262
- 24Sartore, N. et al. (2010). Galactic neutron stars. Astronomy & Astrophysics 510, A23. doi:10.1051/0004-6361/200912222
- 25Olejak, A. et al. (2020). Synthetic catalog of black holes in the Milky Way. Astronomy & Astrophysics 638, A94. doi:10.1051/0004-6361/201936557
- 26Bland-Hawthorn, J. and Gerhard, O. (2016). The Galaxy in Context: Structural, Kinematic, and Integrated Properties. Annual Review of Astronomy and Astrophysics 54, 529-596. doi:10.1146/annurev-astro-081915-023441
- 27McMillan, P. J. (2017). The mass distribution and gravitational potential of the Milky Way. Monthly Notices of the Royal Astronomical Society 465, 76-94. doi:10.1093/mnras/stw2759
- 28Licquia, T. C. and Newman, J. A. (2015). Improved Estimates of the Milky Way's Stellar Mass and Star Formation Rate from Hierarchical Bayesian Meta-Analysis. The Astrophysical Journal 806, 96. doi:10.1088/0004-637X/806/1/96
- 29McKee, C. F., Parravano, A. and Hollenbach, D. J. (2015). Stars, Gas, and Dark Matter in the Solar Neighborhood. The Astrophysical Journal 814, 13. doi:10.1088/0004-637X/814/1/13
- 30Drimmel, R. and Spergel, D. N. (2001). Three-dimensional Structure of the Milky Way Disk: The Distribution of Stars and Dust beyond 0.35 R_sun. The Astrophysical Journal 556, 181-202. doi:10.1086/321556
- 31Rosslowe, C. K. and Crowther, P. A. (2015). Spatial distribution of Galactic Wolf-Rayet stars and implications for the global population. Monthly Notices of the Royal Astronomical Society 447, 2322-2347. doi:10.1093/mnras/stu2525
- 32Liu, J. C., Zhu, Z. and Zhang, H. (2011). Reconsidering the Galactic coordinate system. Astronomy & Astrophysics 526, A16. doi:10.1051/0004-6361/201014961
- 33Manchester, R. N. et al. (2005). The Australia Telescope National Facility Pulsar Catalogue. The Astronomical Journal 129, 1993-2006. doi:10.1086/428488
- 34Yao, J. M., Manchester, R. N. and Wang, N. (2017). A New Electron-density Model for Estimation of Pulsar and FRB Distances. The Astrophysical Journal 835, 29. doi:10.3847/1538-4357/835/1/29
- 35ESA Gaia team. Gaia data release scenario. ESA Cosmos. www.cosmos.esa.int/web/gaia/release
Related in the wiki
Credits
- Pax Abyssi Science Desk
- Author
Spotted an error? Tell us in the forum thread or on the talk page of a related wiki article; corrections are noted at the top of the piece.